Tracking Performance Limits Using Multi-Timescale Maximal Mean Power Ratios
Zignoli, A., Giorgi, A., Kolodziej, F., Martinez-Gonzalez, B., Leo, P., & Laursen, P. B. (2026).
Tracking Performance Limits Using Multi-Timescale Maximal Mean Power Ratios. European Journal of Sport
Science, 26, e70179. Read the full text.
Abstract
This study introduces a multi-timescale mechanical model to quantify proximity to performance limits
during endurance exercise. The model represents power output using a set of rolling averages, each
associated with a characteristic time constant, and identifies the dominant component as the one
approaching its historical maximum at any given time. To demonstrate this framework, real-world data were
collected from 21 male professional cyclists during an 11-day training camp. Data from the first 10 days
were used to construct individual maximal mean power (MMP) profiles across multiple time scales. On the
final day, cyclists completed a fatiguing protocol (~2000 kJ of work) followed by 3-min and 12-min maximal
time trials. During exercise, the ratio between each exponentially weighted component and its
corresponding historical maximum was computed, and the maximum ratio was used to track proximity to
performance limits. At the end of the time trials, this ratio reached 98.6% (94.3%–101%) and 101%
(98.5%–103%) for the 3-min and 12-min efforts, respectively (median and interquartile range), indicating
convergence toward maximal performance capacity. Notably, in both trials the dominant component
corresponded to a slower time scale (~1 h), rather than to components matching the nominal duration of the
efforts. These findings suggest that performance limits emerge from the interaction of multiple time
scales and are not solely dictated by the duration or intensity of the task. This framework extends the
traditional use of MMP from a post hoc descriptive tool to a real-time dynamical measure of performance
capacity.
This is a paper playground: an interactive tool for exploring a research paper with your
own data. Connect your SweatStack account to run this study's model on your own rides and see how close you
come to your performance limits. Find more playgrounds at paperplayground.app.
This tool reads your data from SweatStack. Nothing leaves your browser except requests to the SweatStack API.
The ride replay: power and the maximum ratio across a ride, with the limiting time scale below.
Connecting.
Tracking Performance Limits Using Multi-Timescale Maximal Mean Power Ratios
Zignoli, A., Giorgi, A., Kolodziej, F., Martinez-Gonzalez, B., Leo, P., & Laursen, P. B. (2026).
Tracking Performance Limits Using Multi-Timescale Maximal Mean Power Ratios. European Journal of Sport
Science, 26, e70179. Full text.
This is an interactive playground for exploring this paper with your own data.
Explore more playgrounds.
Abstract
This study introduces a multi-timescale mechanical model to quantify proximity to
performance limits during endurance exercise. The model represents power output using a set of rolling
averages, each associated with a characteristic time constant, and identifies the dominant component as
the one approaching its historical maximum at any given time. To demonstrate this framework, real-world
data were collected from 21 male professional cyclists during an 11-day training camp. Data from the first
10 days were used to construct individual maximal mean power (MMP) profiles across multiple time scales.
On the final day, cyclists completed a fatiguing protocol (~2000 kJ of work) followed by 3-min and 12-min
maximal time trials. During exercise, the ratio between each exponentially weighted component and its
corresponding historical maximum was computed, and the maximum ratio was used to track proximity to
performance limits. At the end of the time trials, this ratio reached 98.6% (94.3%–101%) and 101%
(98.5%–103%) for the 3-min and 12-min efforts, respectively (median and interquartile range), indicating
convergence toward maximal performance capacity. Notably, in both trials the dominant component
corresponded to a slower time scale (~1 h), rather than to components matching the nominal duration of the
efforts. These findings suggest that performance limits emerge from the interaction of multiple time
scales and are not solely dictated by the duration or intensity of the task. This framework extends the
traditional use of MMP from a post hoc descriptive tool to a real-time dynamical measure of performance
capacity.
Zignoli, Giorgi, Kolodziej, Martinez-Gonzalez, Leo and Laursen (2026). Tracking
Performance Limits Using Multi-Timescale Maximal Mean Power Ratios. European Journal of Sport Science.
doi.org/10.1002/ejsc.70179
No profile yet. Open this to build one.
Your profile is the set of historical maxima that the rest of
the tool measures against. We take every cycling session in a window, run each one through the twelve
rolling averages, and for each time scale keep the highest value reached. This is the previous maximal
mean power from the paper. The paper builds the same profile from the first ten days of its training
camp (its Table 1). It is a one time setup. Rebuild it when you want a different window, or after a ride
where you set a new best.
Your power duration ceiling. The historical maxima of the rolling averages
(black) next to the classic mean-max profile over the same window (gray, dashed). The rolling
average ceiling sits lower at long time scales. The note below explains why.Show the numbers
Used for the replay and the fatigue comparison below. It works best
with a long ride, ideally 2 hours or more, that contains at least a few near-maximal efforts. Races are ideal.
The idea
The model represents your power output using a set of rolling averages, each one associated with a
characteristic time constant, and identifies the dominant component as the one approaching its historical
maximum at any given time.
In practice, your power output is passed through twelve exponentially weighted moving averages. Each is
a rolling average over a time constant τ, from 12 seconds up to 4 hours, updated each second with
EWM += (P − EWM)·Δt/τ. Short time constants react quickly to surges; long ones track
sustained effort.
For every time scale we keep the highest value you have ever reached, which is your historical maximum
for that time scale. While you ride, we compare each live rolling average to its historical maximum. The
largest of those ratios is the maximum ratio, your proximity to the limit, where 100% means you
are at it. The time scale that produces the largest ratio is the dominant, or limiting,
component. What is left over is your reserve, the margin to the limit, which is 100% minus the
maximum ratio.
Ride replay
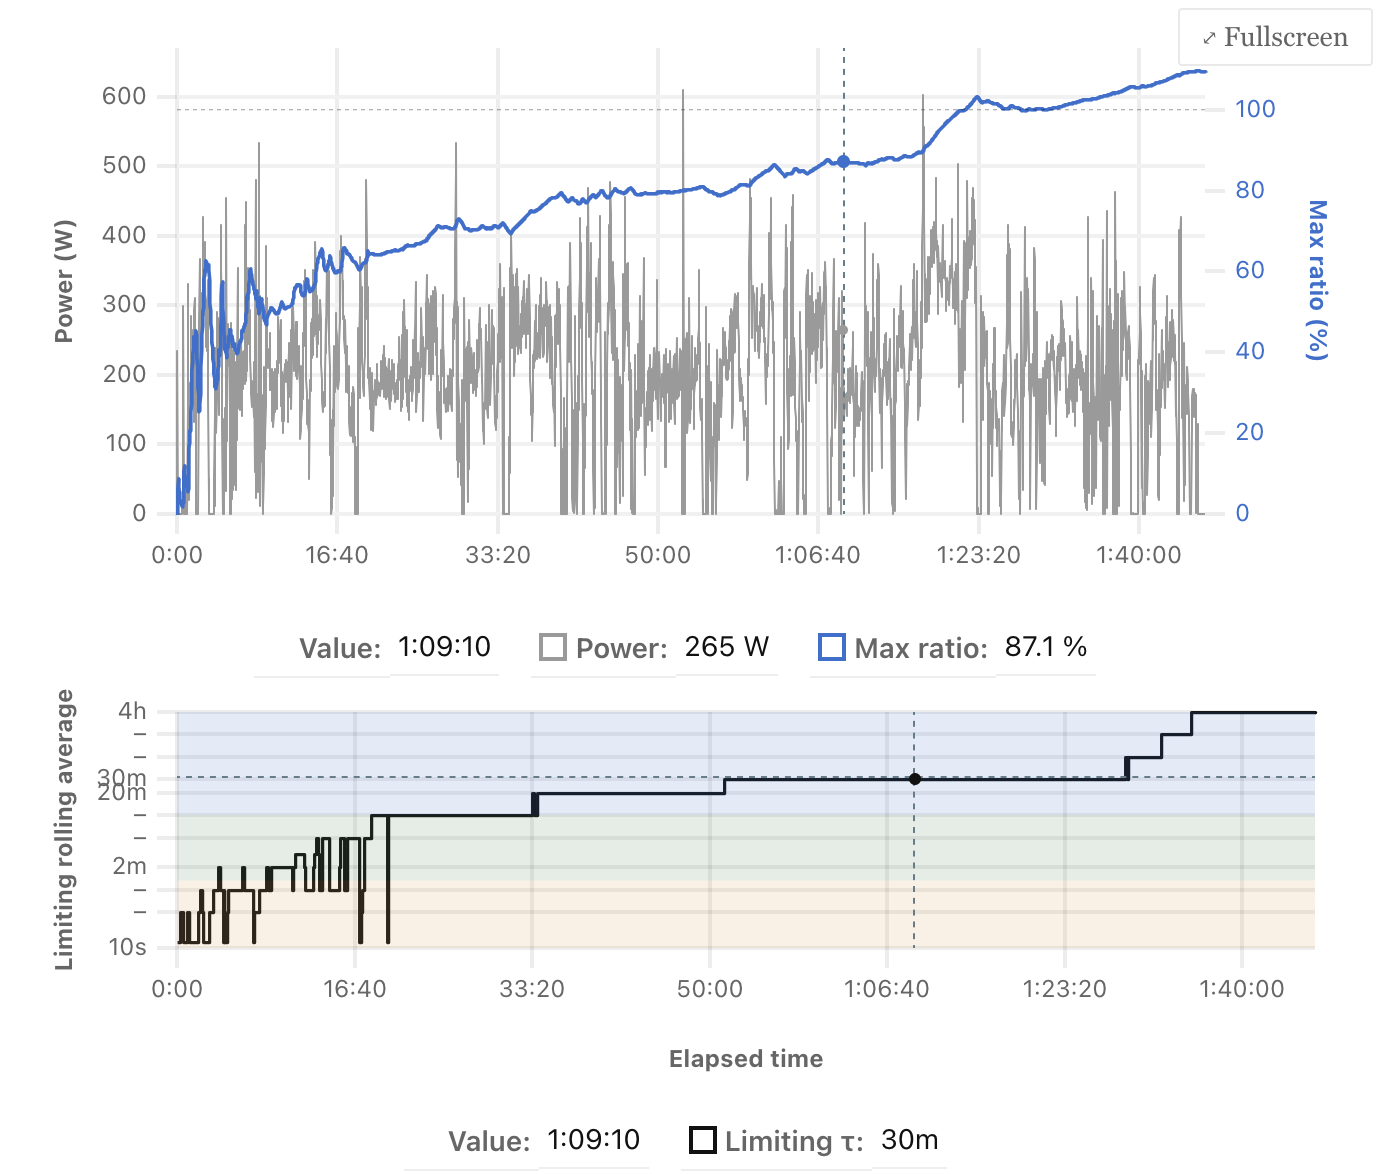
This is Figure 2 from the paper, drawn on your reference activity. The top panel shows your
power output and the maximum ratio over the whole ride. The bottom panel shows the limiting time scale,
the τ of whichever rolling average is closest to its historical maximum at each moment. Hover to read any
point.
Build your profile first, in the panel at the top.
Figure 2. Power output (gray) and the maximum ratio (black, right axis). The
dashed line marks 100%, your limit. Below, the limiting rolling average τ on a logarithmic scale,
shaded by energy system.
Fatigue and the limiting time scale
This is the main result of the paper. Cyclists rode a 3 minute and a 12 minute maximal
effort after about 2000 kJ of fatiguing work. At the point of exhaustion, the limiting time scale was not
the 3 or 12 minute component you would expect from how long the effort lasted. It was a much slower
component, around 1 hour. In the paper's words, performance limits emerge from the interaction of multiple
time scales and are not solely dictated by the duration or intensity of the task.
To show this on your own ride, the tool takes the hardest effort of the length you choose
from the first half of the ride, when you were fresher, and the hardest from the second half, when you
were more fatigued. It runs each against your profile and reports the limiting time scale for each. If the
limit has moved to a slower time scale when you were more tired, you will see it below. This is only an
approximation. Unlike the paper's protocol, the two efforts are not guaranteed to be equally hard.
Build your profile first, in the panel at the top.
Two equal length efforts. The fresh effort (light) and the later, more fatigued
effort (dark) are the highest average windows of the chosen length in the first and second half of
the ride.
Energy systems
Figure 3 in the paper is a conceptual diagram, adapted from Gastin (2001). It is not data
from this study. It suggests which energy system is likely to dominate for a given limiting time scale:
the alactic ATP-PCr system at the shortest scales, anaerobic glycolysis a little longer, and aerobic
metabolism at the long scales. The paper offers it as a way to interpret the model and to generate
hypotheses, not as a measurement. Read the system labels in the replay the same way.
Figure 3. Relative contribution of the energy systems to total supply against the
limiting time scale τ. The dashed marker follows the current limiting τ from the most recent replay or
hover. Conceptual, adapted from Gastin (2001).
What if
Build a session out of blocks of constant power and run it against your profile, without
needing a real ride. You can see when your reserve would reach zero and which time scale would be the
first to limit you. A quick way to test a pacing idea.
Build your profile first, in the panel at the top.
Simulated session. The same two panels as the replay, computed against your stored profile.
Notes on the method
Each rolling average is a first order filter, EWM += (P − EWM)·Δt/τ,
reset to an initial value of zero at the start of every session (Equation 3 in the paper). Because it
starts from zero, the long time scales need a long warm up. A one hour ride can never fully load the four
hour average. This follows from the method, and it is why your long time scale ceilings sit below a
classic mean-max, which is just the best average for each duration looked at after the fact.
Fixed settings, chosen to match the paper. The twelve time constants are
τ = 12, 30, 60, 120, 180, 300, 600, 1200, 1800, 3600, 7200 and 14400 seconds. Missing or coasting power is
treated as 0 W. No pre-smoothing is applied. The energy system labels in section 3 are a conceptual
overlay adapted from Gastin (2001), not measured data.
After Zignoli, Giorgi, Kolodziej, Martinez-Gonzalez, Leo and Laursen (2026), Tracking
Performance Limits Using Multi-Timescale Maximal Mean Power Ratios, European Journal of Sport Science.